Crude Death Rate Prediction Using Economic, Legal and Health-Related Predictors
Method
Data from several sources were joined together into a merged dataset. We use 2016 year to build the model. Main outcome is crude death rate for each state, candidate predictors are law strength, unemployment rate, sleep time, smoking, self-reported health, overweight, population, poverty, mental health, leisure physical activity, drinking, disability and diabetes for each state. Two models were generated using criteria-based model selection and stepwise regression. Models were compared by BIC, adjusted R square, Cp, etc. Models were examined by distribution of residuals (QQ plot, residuals vs fitted value), outliers. We also used cross-validation to compare the two models.
Result
Correlation Matrix
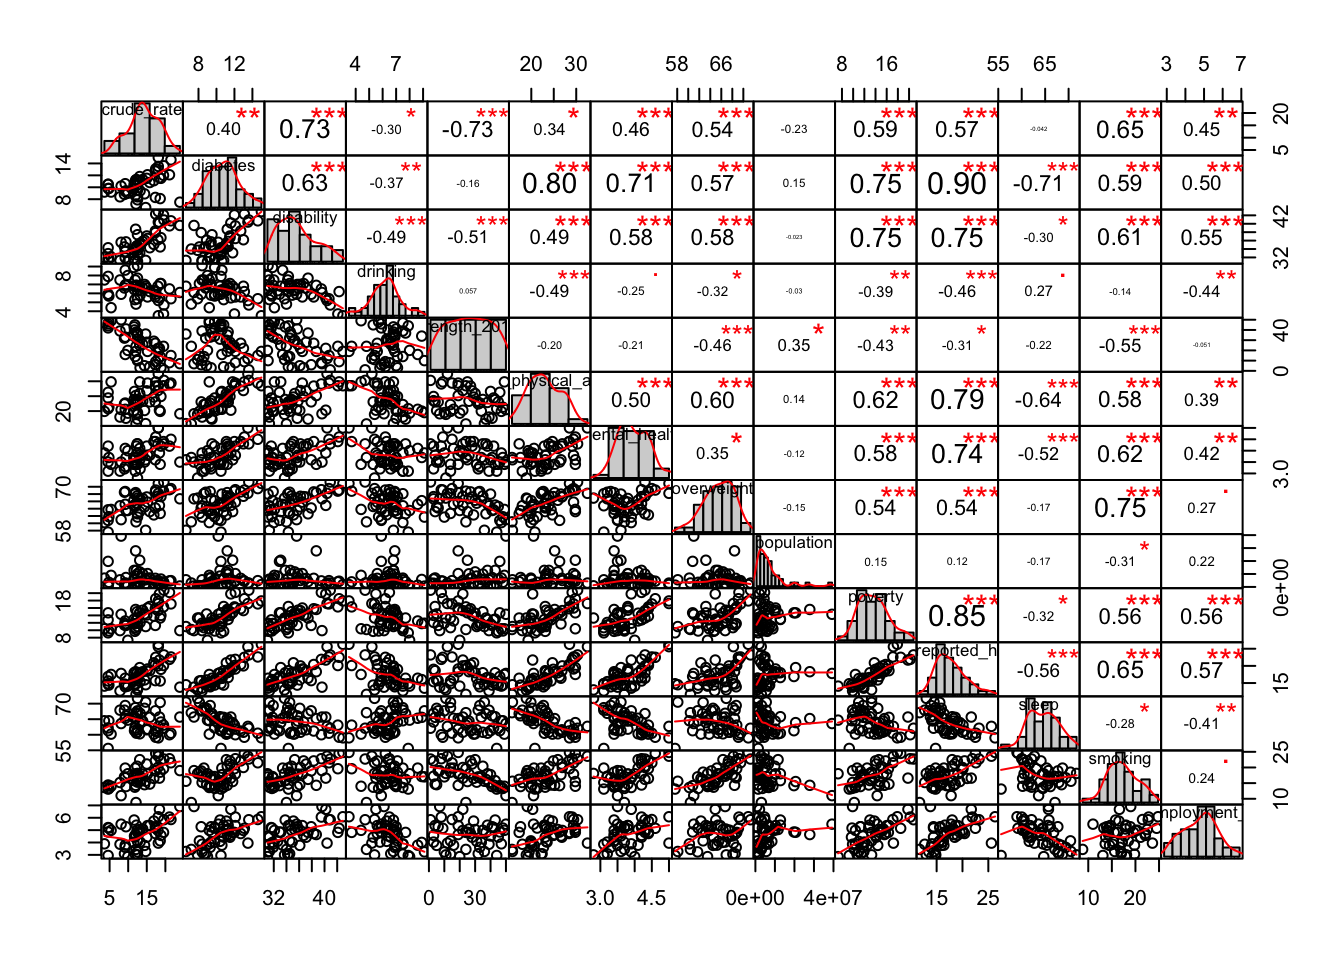
Comments:
Strong correlations can be seen among several pairs of variables. To minimize multi-collinearity, model should be selected carefully.
Most of the variates follow approximately normal distributions.
“Best” model for a given number of variables
| 1 | 2 | 3 | 4 | 5 | 6 | 7 | 8 | |
|---|---|---|---|---|---|---|---|---|
| diabetes | * | |||||||
| disability | * | * | * | * | * | * | ||
| drinking | * | * | * | |||||
| law_strength_2016_only | * | * | * | * | * | * | * | |
| leisure_physical_activities | * | * | * | * | ||||
| mental_health | ||||||||
| overweight | ||||||||
| population | ||||||||
| poverty | ||||||||
| self_reported_health | * | * | * | |||||
| sleep | ||||||||
| smoking | * | * | * | * | * | * | ||
| unemployment_rate | * | * | * | * | * | * |
Comments:
It seems that “Law Strength”, “Smoking”, “Disability”, and “Unemployment Rate” are all strong predictors. “Leisure & Physical Activities” appears in larger models.
R-squared, BIC, Cp, Regression Sum of Squares, Residual Sum of Squares
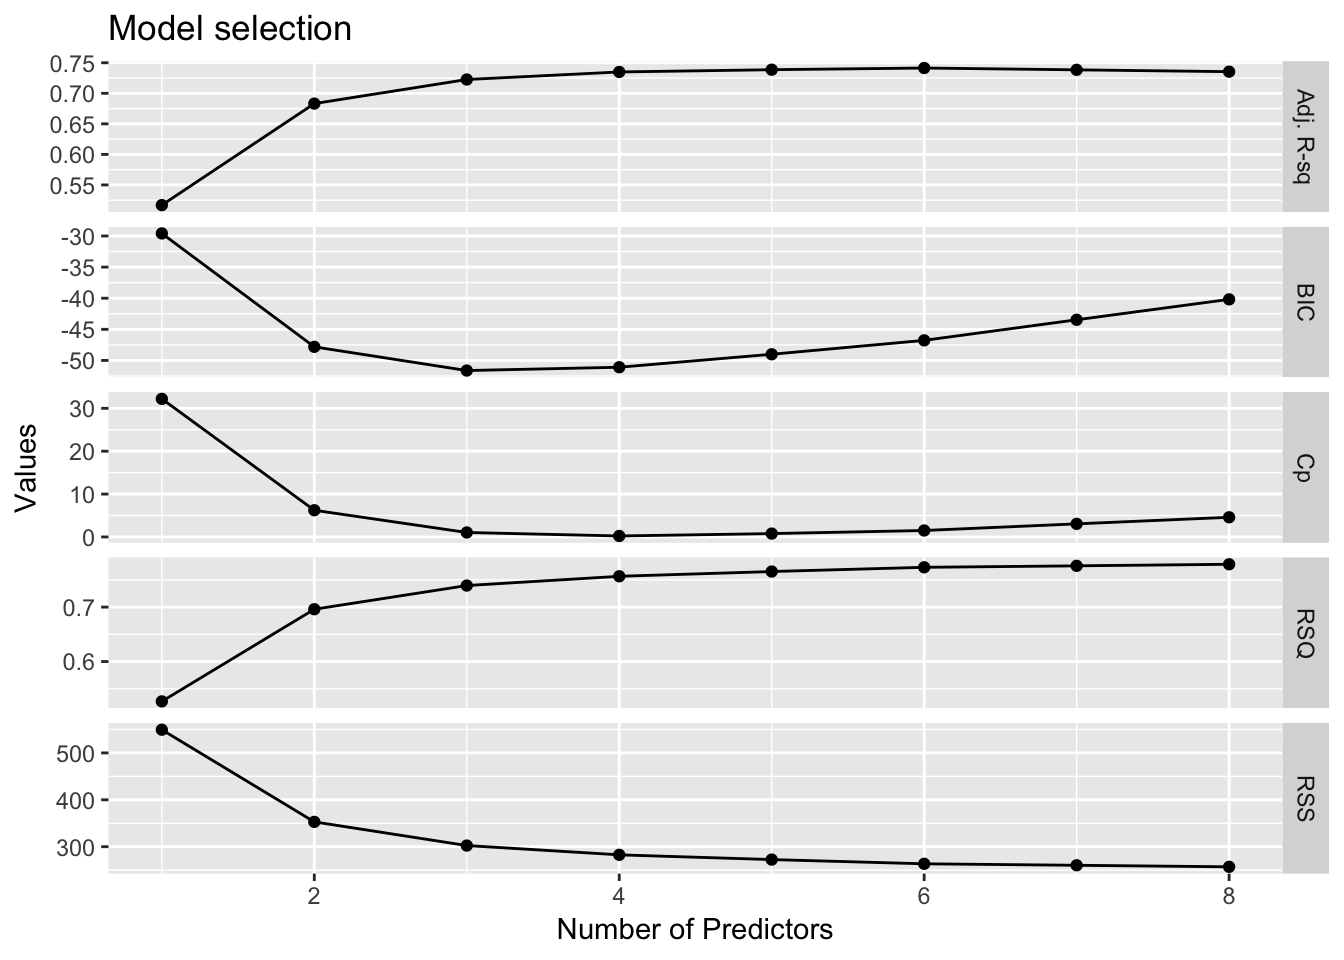
Comments:
The model with four predictors seems to have the highest adjusted R-squared value, lowest BIC and Cp values, and has a high regression mean sum of squares and low residual mean sum of squares. The six-predictor model has similar model statistics as the four-predictor model, with the exception of the higher BIC value.
Two selected models of interest
Model from stepwise selection:
| term | estimate | std.error | statistic | p.value |
|---|---|---|---|---|
| (Intercept) | 10.4708267 | 4.6327477 | 2.260176 | 0.0289302 |
| drinking | -0.6333038 | 0.3807451 | -1.663327 | 0.1035197 |
| law_strength_2016_only | -0.1759851 | 0.0299607 | -5.873866 | 0.0000006 |
| leisure_physical_activities | -0.3321040 | 0.1482859 | -2.239619 | 0.0303397 |
| self_reported_health | 0.3079383 | 0.2168874 | 1.419807 | 0.1628735 |
| smoking | 0.4285323 | 0.1605796 | 2.668659 | 0.0106983 |
| unemployment_rate | 1.3501531 | 0.4602038 | 2.933815 | 0.0053517 |
| r.squared | adj.r.squared | sigma | statistic | p.value | df | |
|---|---|---|---|---|---|---|
| value | 0.7730692 | 0.7414044 | 2.475718 | 24.41418 | 0 | 7 |
Comments:
Drinking, law strength, and leisure all seem to be negatively associated with firearm crude death rate. Self-rated health, smoking, and unemployment rate are all positively associated with the firearm crude death rate.
Criteria based model:
| term | estimate | std.error | statistic | p.value |
|---|---|---|---|---|
| (Intercept) | -3.8337969 | 5.0898242 | -0.7532278 | 0.4552359 |
| disability | 0.3050451 | 0.1719631 | 1.7738989 | 0.0828465 |
| law_strength_2016_only | -0.1683490 | 0.0320384 | -5.2545962 | 0.0000039 |
| smoking | 0.2598411 | 0.1371695 | 1.8943066 | 0.0646220 |
| unemployment_rate | 1.2927511 | 0.4552585 | 2.8395980 | 0.0067578 |
| r.squared | adj.r.squared | sigma | statistic | p.value | df | |
|---|---|---|---|---|---|---|
| value | 0.7565902 | 0.7349538 | 2.506406 | 34.96835 | 0 | 5 |
Comments:
Disability, smoking, and unemployment rate are all positively associated with the firearm crude death rate. Law strength is negatively associated with the firearm crude death rate.
Model diagnostics
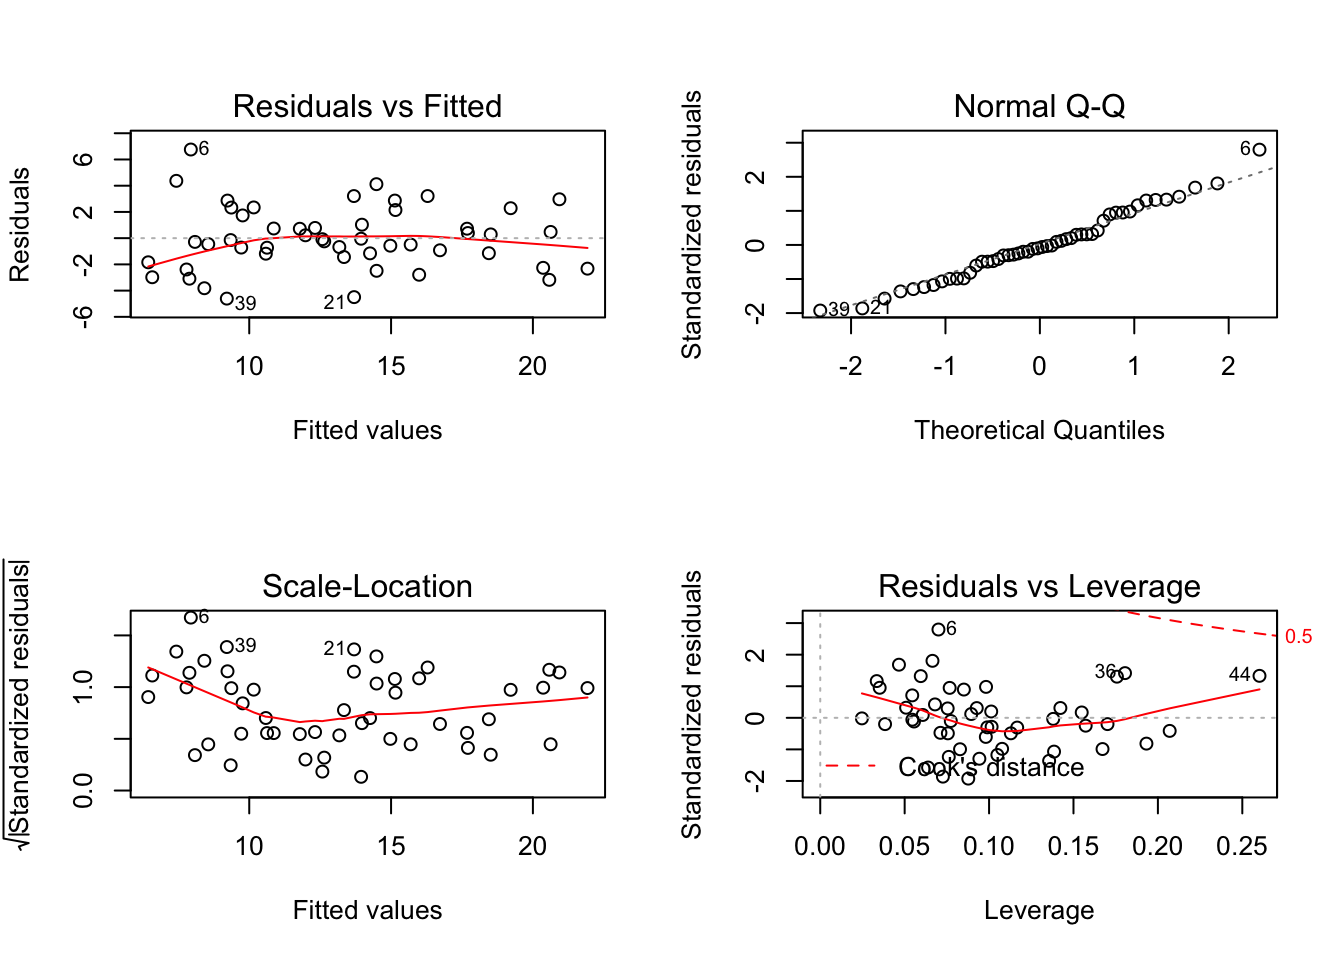
Criteria-based model (4 predictors)
Stepwise model (6 predictors)
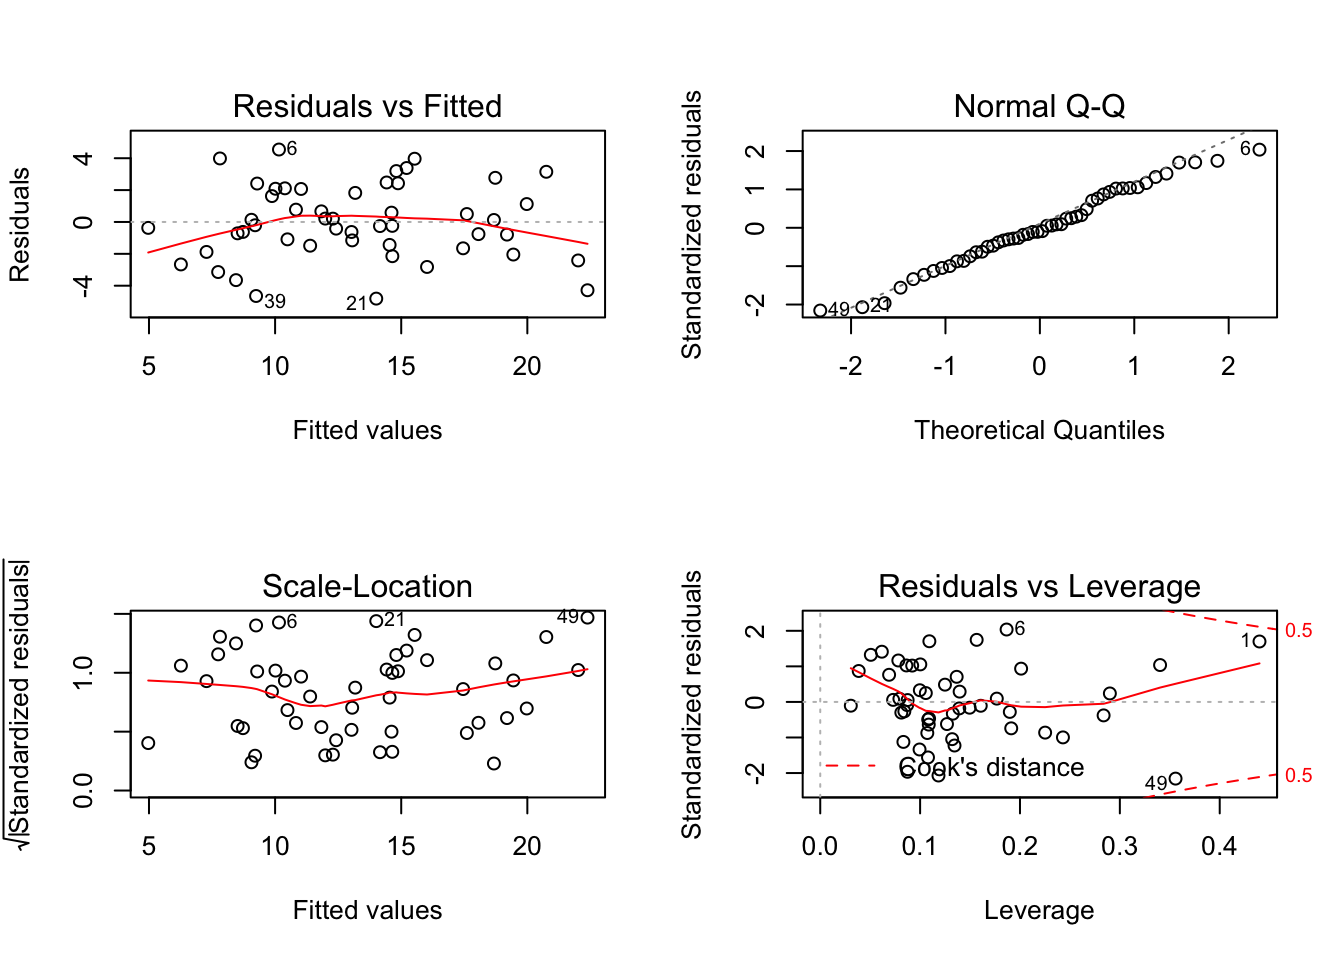
Comments: For both models, no severe outliers were observed. Residuals seem to follow a normal distribution. Residuals don’t hold constant over fitted values, but are still clustered around zero and not severely biased.
Cross validation
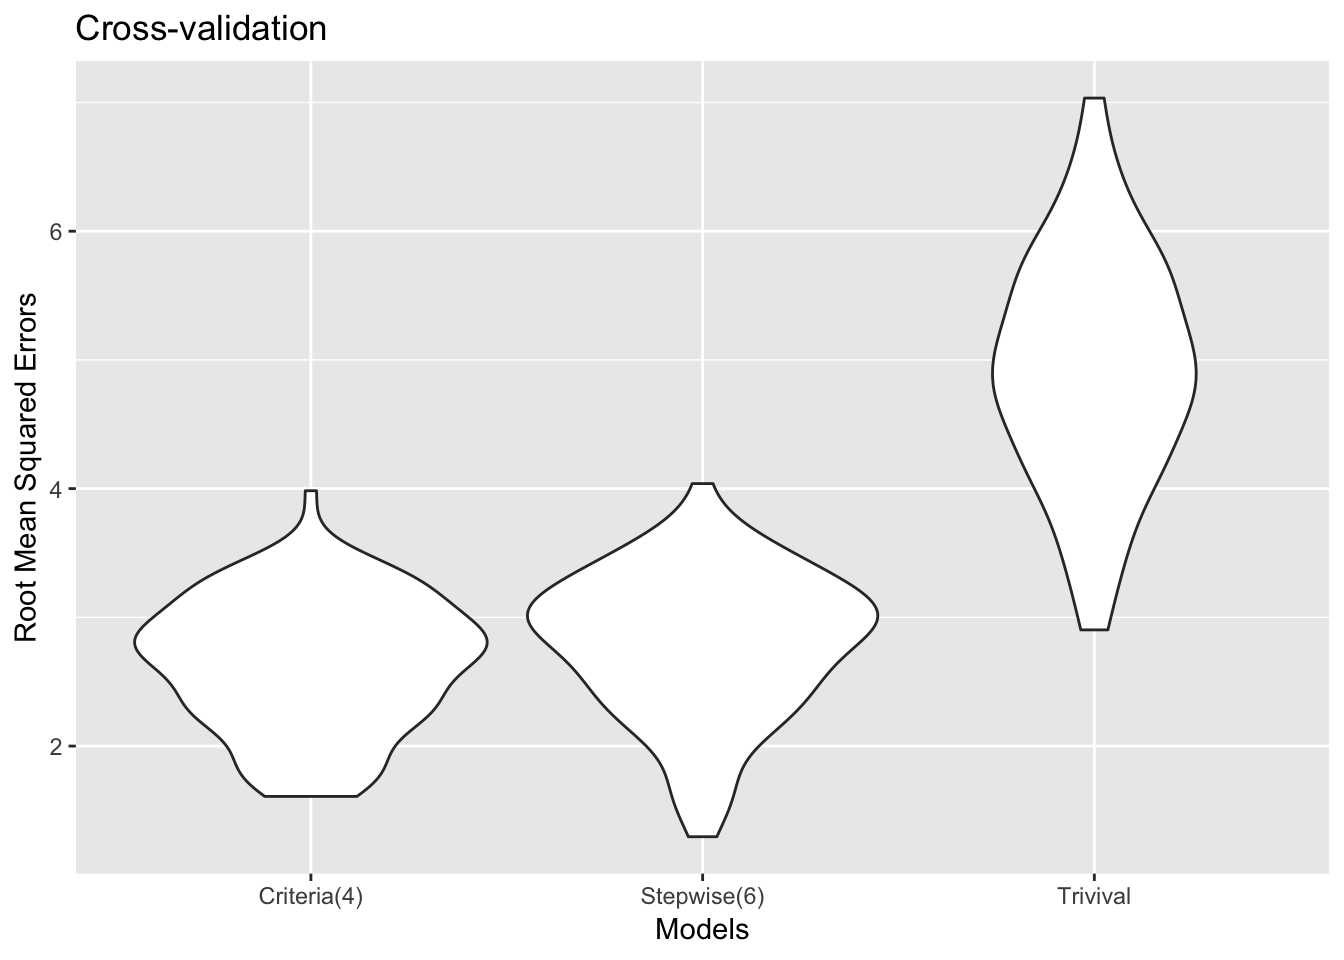
Comments:
Our four-predictor model seems to have a slightly lower root-mean-squared error (RMSE) value than the six-predictor model. They are both better than the trivial model of y ~ 1. For parsimony, we would ultimately choose the four-predictor model.
Conclusion
Four-predictor model (disability, smoking, unemployment rate, law strength) seems to perform a little better than six-predictor model (drinking, law strength, leisure, self-rated health, smoking and unemployment rate). Model diagnosis shows that the residuals of both models agree with the underlying assumption. Cross validation shows a little higher rmse for six-predictor model than four-predictor model. Disability, smoking, unemployment rate positively associate with the firearm crude death rate. Law strength negatively associate with crude death rate.